Cheap Cost Segregation Study: What $495 Actually Gets You
A cheap cost segregation study uses the same industry-standard construction cost data and the same IRS rules as a $5,000 study. Three real $200K–$275K rentals showing 16×–40× ROI — and the cases where the math doesn't work.

A cheap cost segregation study uses the same industry-standard construction cost data and the same IRS rules as a $5,000 study. Three real $200K–$275K rentals showing 16×–40× ROI — and the cases where the math doesn't work.
A cheap cost segregation study costs $495 for single-family rentals, short-term rentals, and condos under $300K. It uses the same industry-standard construction cost data, the same IRS MACRS classification rules, and produces the same 40+ page CPA-ready report as studies costing $5,000–$15,000 at traditional engineering firms. The difference is delivery method, not methodology — automated engineering eliminates the $1,000–$3,000 of travel and on-site labor that traditional firms bake into their fee.
“Cheap cost segregation study” is investor shorthand for the same engineered study, delivered without the legacy overhead. The IRS Cost Segregation Audit Techniques Guide (Pub 5653) does not require a physical site visit; it requires component-level documentation per Rev. Proc. 87-56 — which automated providers produce identically.
cost segregation methodology → · compare 25 cheap cost seg providers →
Key Takeaways
- A $495 study on a $250K rental produces ~$9,600 in Year 1 tax savings at 24% — a 19x ROI on the study fee
- Traditional firms charge $5,000+ because they send engineers on-site; the IRS doesn’t require a site visit
- The methodology (construction cost data, MACRS, component-level classification) is identical regardless of price
- If your property is under $100K or you’re in the 12% bracket, the ROI gets thin — and we’ll tell you that
You Spent Six Figures on a Rental. But You Won’t Spend $495 on Taxes?
Think about what you spent to close on your last rental property. Purchase price: $250K. Closing costs: $7,500. Home inspection: $400. Appraisal: $500. First month’s insurance: $180. You spent more on the appraisal — a document you looked at once — than you would on a cost segregation study that saves you $6,000 to $15,000 in Year 1 taxes.
Most rental property owners skip cost segregation for one of two reasons. Either they’ve never heard of it, or they heard it costs $5,000 and decided the math doesn’t work on a $250K property. They’re right about the second part. At $5,000, the math on a $250K property is thin. At $495, the math is absurd — absurdly good.
Let’s walk through three real scenarios. Not hypothetical “if you had a $3M office building” examples. Actual modest rentals in actual cities that actual investors own.
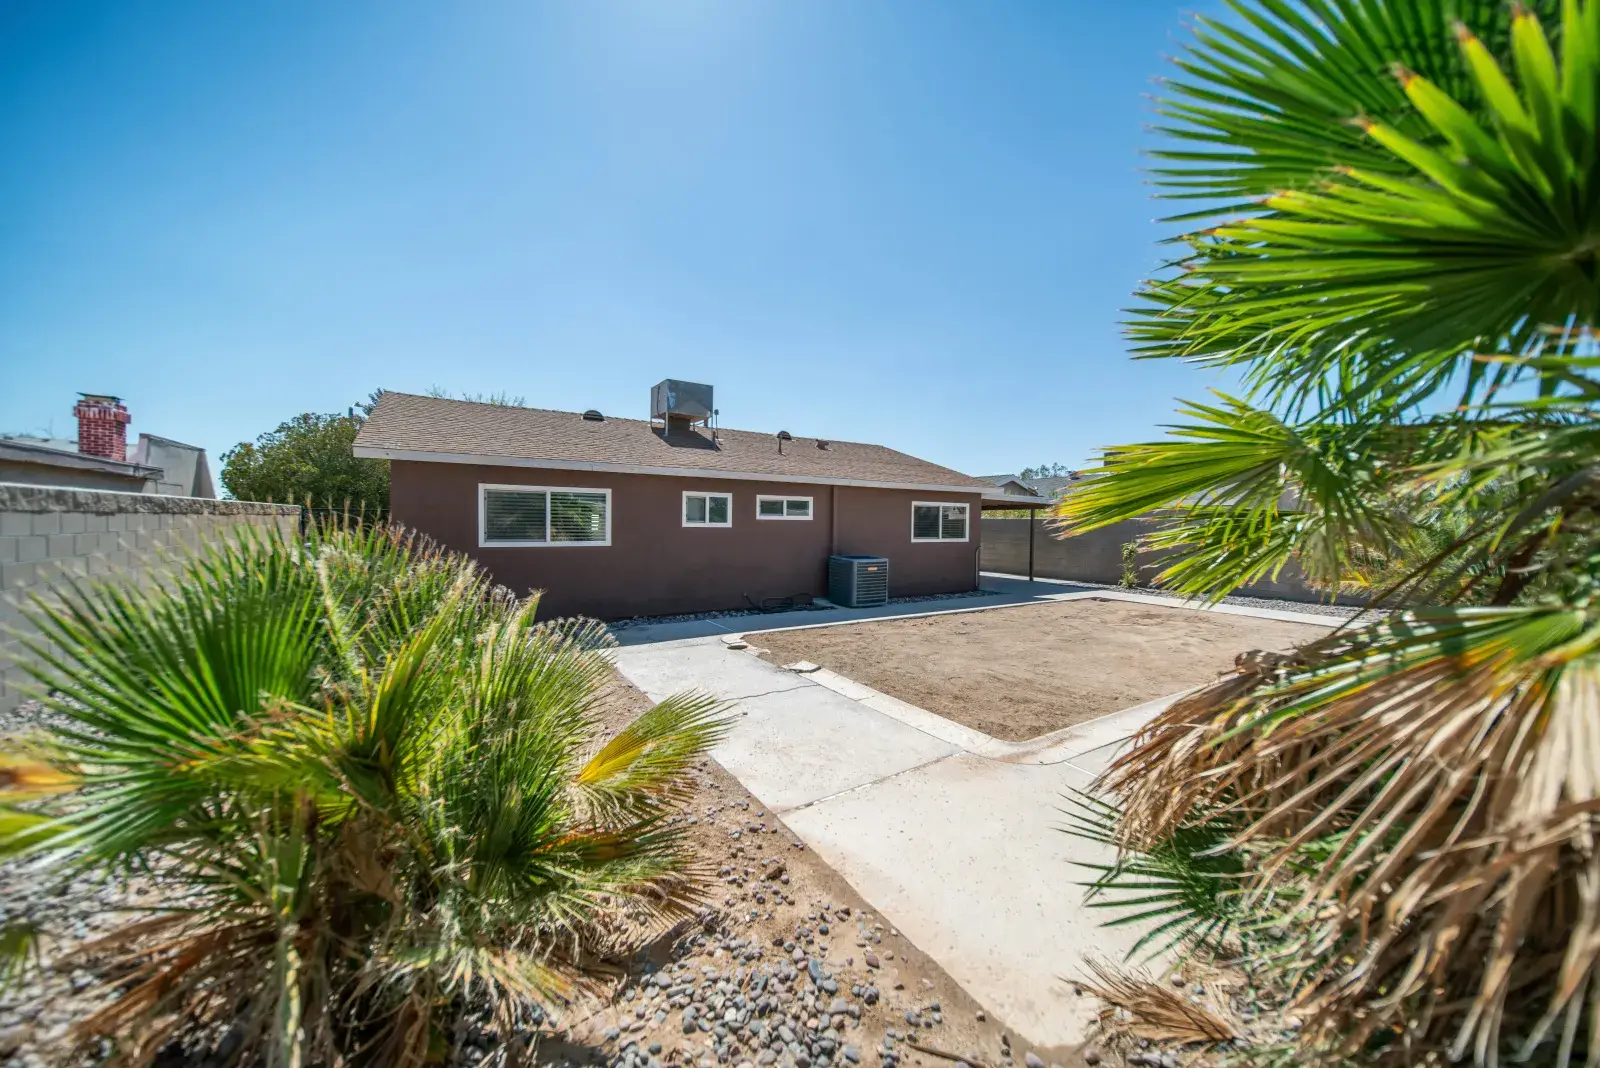
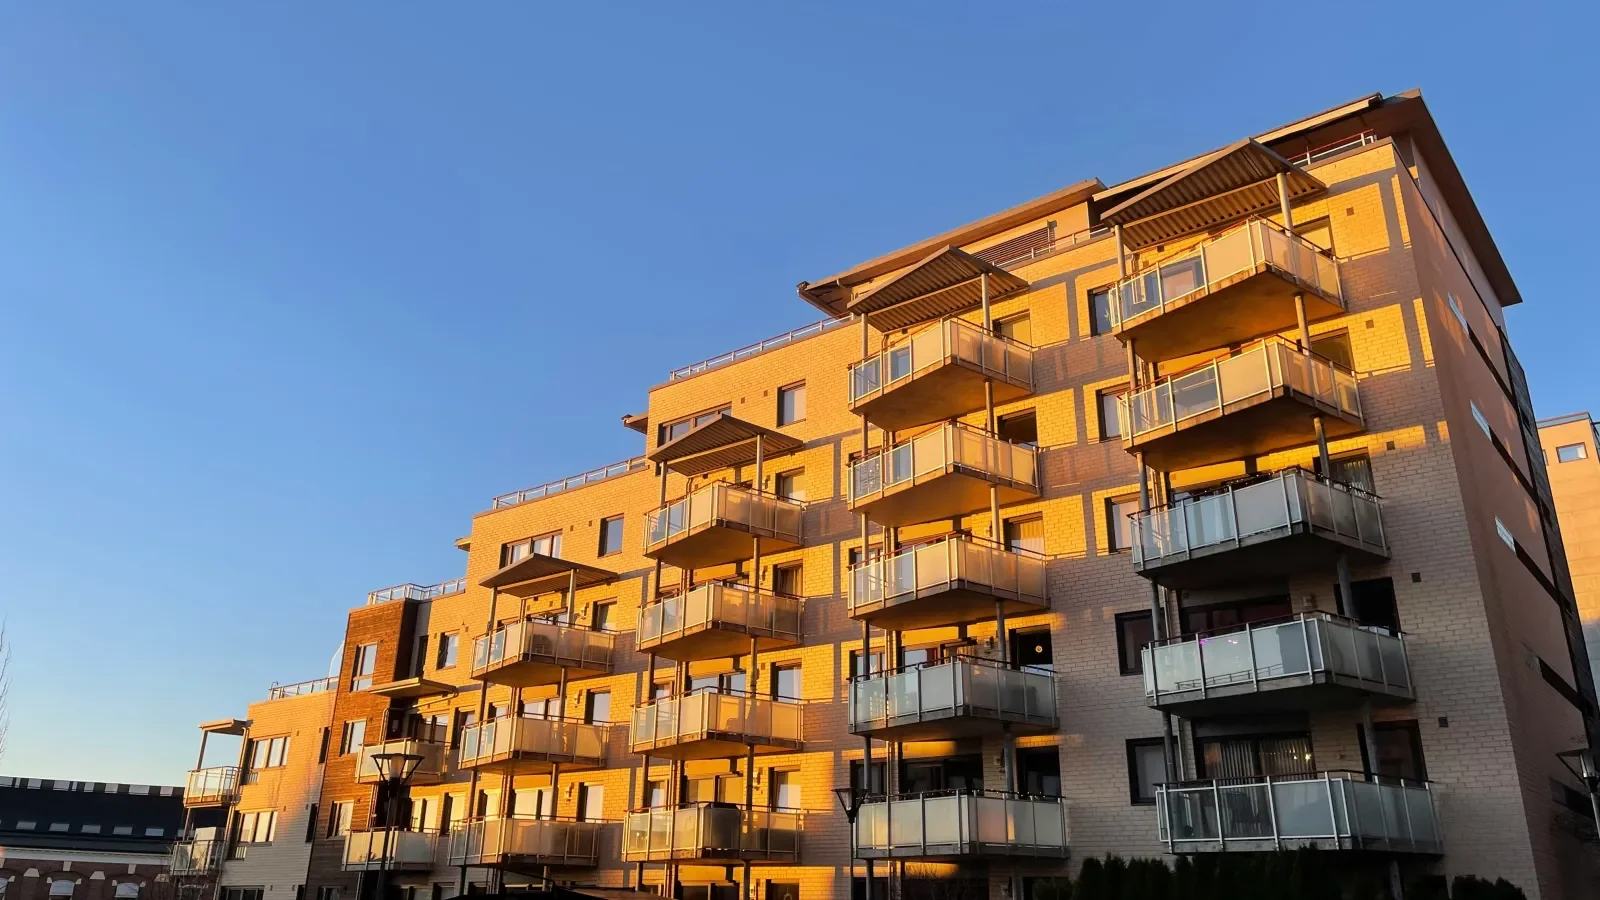
This is the kind of property where $495 cost segregation actually shines. Not the $2M beachfront villa — the $225K rental with a front porch and pumpkins.
Three Real Properties, Three Real Tax Bills
$225K long-term rental, Memphis suburbs
| Line item | Amount |
| Purchase price | $225,000 |
| Land allocation (modeled) | ($45,000) |
| Depreciable basis | $180,000 |
| Reclassified to 5/7/15 year (19%) | $34,200 |
| Year 1 deduction (100% bonus) | $34,200 |
| Tax savings at 24% bracket | $8,208 |
| Study fee | $495 |
| ROI on study | 16.6× |
You spent less on the study than on your last appliance replacement. And the appliance didn’t save you $8,200.
$275K furnished Airbnb, Branson MO
| Line item | Amount |
| Purchase price | $275,000 |
| Land allocation (modeled) | ($55,000) |
| Depreciable basis | $220,000 |
| Reclassified to 5/7/15 year (28%) | $61,600 |
| Year 1 deduction (100% bonus) | $61,600 |
| Tax savings at 32% bracket | $19,712 |
| Study fee | $495 |
| ROI on study | 39.8× |
The hot tub you installed for $4,000? Five-year property. The deck you built for $8,000? Fifteen-year property. The study that identified both? $495. Furnished STRs hit 28% reclassification because everything you see inside — beds, couches, TVs, kitchen equipment, décor — is 5-year personal property under MACRS.

What your CPA actually sees: depreciation schedules by MACRS class, component-level breakdown, Form 4562 support. Same deliverable whether the study cost $495 or $5,000.
$180K duplex, Cleveland OH — lookback study
| Line item | Amount |
| Purchase price (2021) | $180,000 |
| Land allocation (modeled) | ($36,000) |
| Depreciable basis | $144,000 |
| Reclassified to 5/7/15 year (17%) | $24,480 |
| Section 481(a) catch-up (4 missed years) | $18,200 |
| Total Year 1 accelerated deduction | $42,680 |
| Tax savings at 24% bracket | $10,243 |
| Study fee | $495 |
| ROI on study | 20.7× |
Four years of depreciation this investor never claimed, caught up in one filing. Form 3115 makes that legal. The $18,200 catch-up plus the current-year reclassification lands as a single adjustment on the 2026 return. The owner found out about this from a Reddit thread.
But does it work on a $100K property?
This is the bare-minimum scenario. A $100K rental in a secondary market — maybe a small duplex in a Rust Belt town or a starter SFR in rural Tennessee. Does the math still pencil at $495?
$100K single-family rental, small-town Tennessee
| Line item | Amount |
| Purchase price | $100,000 |
| Land allocation (modeled) | ($15,000) |
| Depreciable basis | $85,000 |
| Reclassified to 5/7/15 year (18%) | $15,300 |
| Year 1 deduction (100% bonus) | $15,300 |
| Tax savings at 24% bracket | $3,672 |
| Study fee | $495 |
| ROI on study | 7.4× |
$3,672 in tax savings on a $495 study. That’s a 7.4x return. Not the 40x you see on a $275K Airbnb — but you’re still netting $3,177 on a single tax filing. Most people spend more than $495 on a single plumbing call. The ROI is positive, the deduction is real, and the study fee is tax-deductible as a business expense.
our Airbnb tax strategy guide →
At a 32% bracket, the same $100K property produces $4,896 in Year 1 savings — a 9.9x return. The math works. It’s just not as dramatic as larger properties.
Note on land allocation: we don’t just assume 20% for every property. Our engine models land value using county assessor data, metro-level land ratios, and price-per-square-foot adjustments. On a $100K rural property, land might be 12–18%. On a $500K property in a high-cost metro, it could be 25–35%. The land estimate matters — it directly affects your depreciable basis and the final savings number.
The $495 Study vs The $5,000 Study: Same Report, Different Overhead
Traditional cost segregation firms charge $5,000 to $15,000 because they have offices to rent, engineers to fly in, scheduling coordinators to pay, and sales teams to commission. An engineer drives to your property, spends half a day walking through it, then goes back to the office and runs the same analysis we run remotely. The travel and labor alone add $1,000 to $3,000 before the engineering even starts.
We use satellite imagery, county assessor data, and industry-standard construction cost databases — the same cost data traditional firms use — to perform the component-level analysis remotely. The IRS Cost Segregation Audit Techniques Guide does not require a physical site visit. It requires detailed documentation of building components. Both approaches produce that documentation.
It’s like comparing a $15 Uber to a $50 taxi. Same ride. Same destination. Different overhead. For investors with smaller properties, we run a separate budget-focused site at cheapcostseg.com that walks through when sub-$500 studies still pencil out.
One thing worth being clear about: The cost data is not proprietary technology — it’s industry-standard construction cost data used by every engineering firm in the country. MACRS classification rules are published by the IRS under Revenue Procedure 87-56. The 13 principal elements required for a defensible study are published in the IRS ATG. None of this is secret. The only question is whether the analysis is done well — and our reports have been reviewed and filed by CPAs in all 50 states.
What’s Actually in the Report
Every study — regardless of price — includes:
200+ component analysis using industry-standard 2026 construction cost data. Every building element from the foundation to the roof gets identified, valued, and classified.
MACRS classification into 5-year, 7-year, 15-year, and 27.5 or 39-year depreciation schedules. This is where the reclassification happens — moving components out of the slow schedule into the fast ones.
Full depreciation schedules your CPA maps directly to IRS Form 4562. No additional engineering work on their end.
Form 3115 documentation for lookback studies, including the Section 481(a) catch-up calculation.
Audit defense package aligned to the 13 principal elements every IRS-defensible cost seg study must include.
Your CPA opens the PDF, drops the numbers into the return, and files. That’s it.
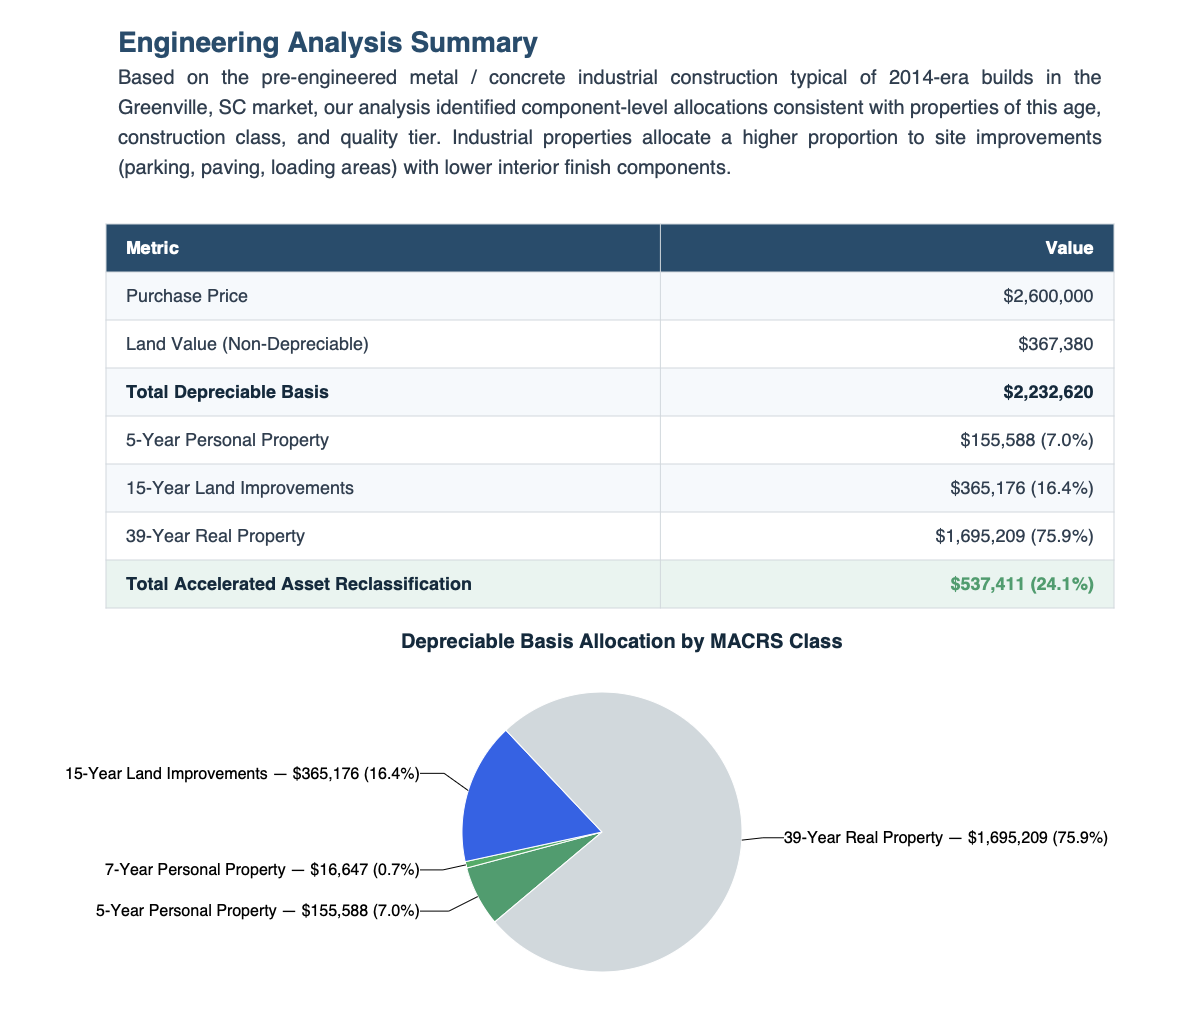
An actual page from a delivered study. Component-level MACRS classification, cost allocation, and depreciation schedule — the same output a $10,000 study produces.
You’re selling within 18 months without a 1031 exchange. Depreciation recapture under IRC §1250 taxes the accelerated depreciation at up to 25% when you sell. If you’re selling soon, you front-loaded the deduction only to pay most of it back. It’s a timing shift that might not help. Model it with your CPA first.
You already did cost seg on this property. You can’t reclassify the same components twice. If a prior owner or a previous firm already ran a study, a second one won’t produce additional savings. Check your prior tax records or ask your CPA.
If any of these apply, we’d genuinely rather you spend $495 on something else. We’d rather have you come back when the math works than sell you something that doesn’t.
But Is a $495 Study… Legit?
We get this question a lot. And it’s a fair question. If every other firm charges $5,000, why wouldn’t you be suspicious of $495?
Here’s the honest answer: traditional firms are honestly pricing their overhead. They have offices, staff, travel budgets, and sales teams. Those are real costs. We don’t have those costs because we deliver remotely. That’s the entire explanation. There’s no corner being cut on the engineering side.
The IRS Cost Segregation Audit Techniques Guide — the document that defines what makes a study defensible — has 13 principal elements. Our reports address all 13. The guide explicitly states that observation and documentation can be accomplished through multiple methods, including remote observation. It does not mandate a physical walkthrough.
We also offer a CPA-Ready Guarantee: if your CPA requests changes to the report format or documentation, we’ll revise it. If we can’t resolve the issue to their satisfaction, you get a full refund. We can do that because the revision rate is under 2%. The reports work.
If you want to see one before you buy, here’s a sample report. For ratings across providers, see costsegregationreviews.com — a comparison resource we maintain.
What a Study Costs by Property Value
The $495 headline is our entry price. It’s one flat fee that scales with the property’s purchase price — and even at the top of the residential ladder it stays a fraction of the $5,000–$15,000 a traditional firm charges:
| Purchase price (single-family / STR / condo) | Study fee |
|---|---|
| Under $300K | $495 |
| $300K–$700K | $895 |
| $700K–$1M | $995 |
| $1M–$1.5M | $1,295 |
| $1.5M–$2M | $1,595 |
| $2M–$3M | $1,995 |
| $3M–$4M | $2,495 |
| $4M–$6M | $3,995 |
| $6M–$8M | $5,995 |
| $8M–$10M | $7,995 |
| $10M+ | Custom proposal |
Multifamily (2–4 units) and commercial properties run on their own ladders (starting at $795 and $1,995 respectively) — see the full pricing breakdown. Whatever the tier, the study is built to cost a small fraction of the first-year tax savings it unlocks.
Related Reading
- Cost Segregation Under $500K: Does the Math Work?
- Full Pricing Breakdown: $495 to $15,000
- Cheap & Fast Cost Segregation for Small Rentals
Frequently Asked Questions Is a $495 cost segregation study the same quality as a $5,000 study?
Yes. Both use industry-standard construction cost data, both classify building components under IRS MACRS asset class rules, and both produce 40+ page CPA-ready reports with depreciation schedules and audit documentation. The price difference is delivery method — traditional firms include a physical site visit ($1,000–$3,000 in travel and labor). The IRS Cost Segregation Audit Techniques Guide does not require a site visit. It requires detailed component-level documentation, which both approaches produce. What’s the catch with affordable cost segregation?
There’s no catch, but there are honest limitations. A $495 study doesn’t include a physical site visit — it uses satellite imagery, county assessor data, and engineering cost databases instead. For 95% of residential properties, this produces the same component-level analysis. For complex mixed-use buildings over $5M, unusual construction methods, or properties where you specifically expect an IRS examination, a traditional on-site study may be worth the higher fee. Can my CPA use a $495 report on my tax return?
Yes. The report is structured so your CPA can map the depreciation schedules directly to IRS Form 4562. It includes MACRS class assignments for every component, bonus depreciation calculations, and Form 3115 documentation for lookback studies. We offer a CPA-Ready Guarantee: if your CPA requests format or documentation changes, we’ll revise the report. If we can’t resolve the issue, you get a full refund. Does the $495 price apply to all property types?
The $495 price is our entry tier — it applies to single-family rentals, short-term rentals (Airbnb/VRBO), and condos with a purchase price under $300,000. The flat fee scales modestly with property value from there: $300K–$700K is $895, and $700K–$1M is $995, then it steps up by band ($1,295 at $1M–$1.5M, and so on). Multifamily (2–4 units) starts at $795; commercial starts at $1,995. Even at the upper residential bands, a study is a fraction of the typical $5,000–$15,000 a traditional firm charges — and a small fraction of the first-year tax savings it unlocks. The full pricing breakdown is here. How long does a $495 study take to deliver?
Under one hour from order to delivery. You enter your property details at checkout — address, purchase price, square footage, year built — and the engineering analysis runs immediately. The finished PDF report is emailed to you, typically within 30–60 minutes. Traditional firms take 4–8 weeks because of site visit scheduling and manual engineering queues. What if I already did cost segregation on this property?
You can only do one cost segregation study per property. If a prior owner or a previous firm already performed the analysis, a second study won’t produce additional reclassification. Check with your CPA or the property’s prior tax records before ordering. If you’re unsure, text us and we can help you check.
See What $495 Produces on Your Property
Frequently asked
Is a $495 cost segregation study the same quality as a $5,000 study?
Yes. Both use industry-standard construction cost data, both classify building components under IRS MACRS asset class rules, and both produce 40+ page CPA-ready reports with depreciation schedules and audit documentation. The price difference is delivery method — traditional firms include a physical site visit ($1,000–$3,000 in travel and labor). The IRS Cost Segregation Audit Techniques Guide does not require a site visit. It requires detailed component-level documentation, which both approaches produce.
What's the catch with affordable cost segregation?
There's no catch, but there are honest limitations. A $495 study doesn't include a physical site visit — it uses satellite imagery, county assessor data, and engineering cost databases instead. For 95% of residential properties, this produces the same component-level analysis. For complex mixed-use buildings over $5M, unusual construction methods, or properties where you specifically expect an IRS examination, a traditional on-site study may be worth the higher fee.
Can my CPA use a $495 report on my tax return?
Yes. The report is structured so your CPA can map the depreciation schedules directly to IRS Form 4562. It includes MACRS class assignments for every component, bonus depreciation calculations, and Form 3115 documentation for lookback studies. We offer a CPA-Ready Guarantee: if your CPA requests format or documentation changes, we'll revise the report. If we can't resolve the issue, you get a full refund.
Does the $495 price apply to all property types?
The $495 price is our entry tier — single-family rentals, short-term rentals (Airbnb/VRBO), and condos under $300,000. The flat fee scales with property value: $300K–$700K is $895, $700K–$1M is $995, then it steps up by band ($1,295 at $1M–$1.5M). Multifamily (2–4 units) starts at $795; commercial starts at $1,995. Even at the upper bands it's a fraction of the typical $5,000–$15,000 study.
How long does a $495 study take to deliver?
Under one hour from order to delivery. You enter your property details at checkout — address, purchase price, square footage, year built — and the engineering analysis runs immediately. The finished PDF report is emailed to you, typically within 30–60 minutes. Traditional firms take 4–8 weeks because of site visit scheduling and manual engineering queues.
What if I already did cost segregation on this property?
You can only do one cost segregation study per property. If a prior owner or a previous firm already performed the analysis, a second study won't produce additional reclassification. Check with your CPA or the property's prior tax records before ordering.