DC's tri-jurisdictional tax landscape creates one of the highest combined marginal rates in the country — DC's 10.75% top rate plus 37% federal pushes combined tax to ~47.8%. Row houses in Capitol Hill, Shaw, and Georgetown ($1.15M typical) owned by federal workers, contractors, and lobbyists produce large bases. Cost segregation typically accelerates $80K–$150K into Year 1 — yielding $40K–$70K in combined tax savings.
The DC Metro: Where Federal Workers Buy Investment Properties
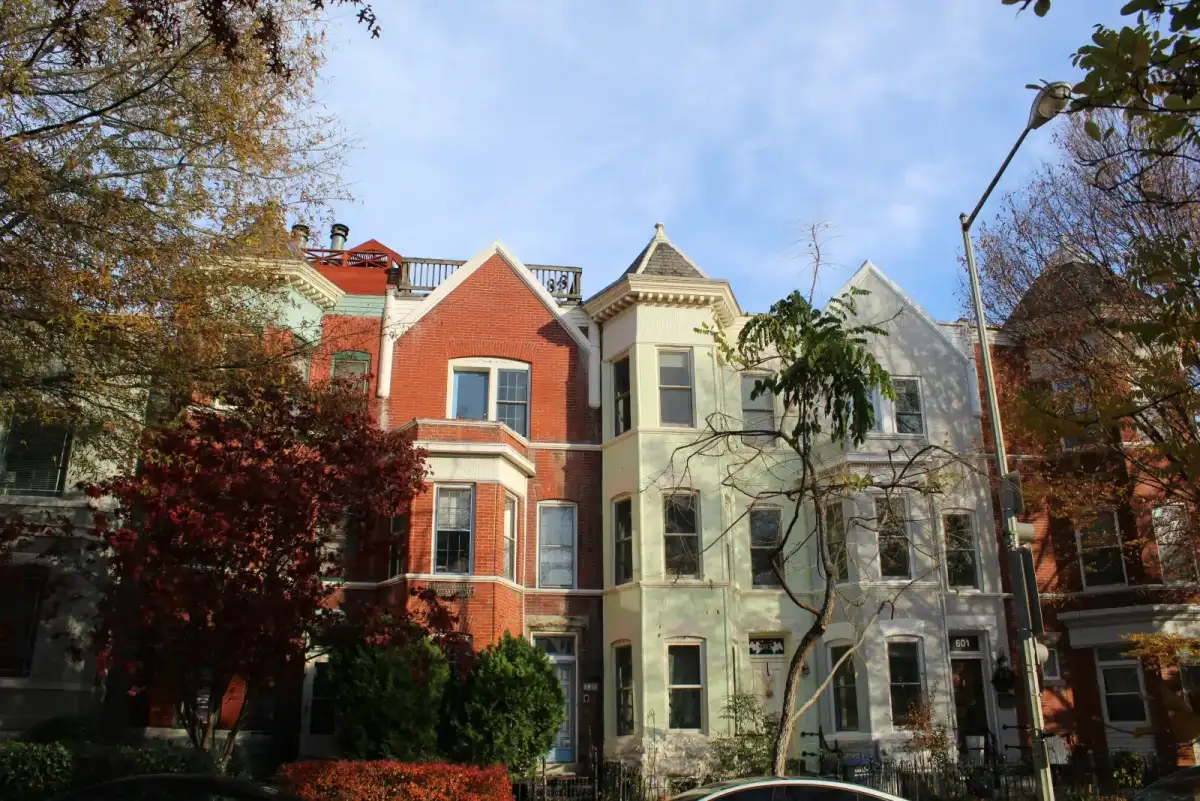
The Washington DC metropolitan area has one of the highest concentrations of high-income professionals in the country. Federal employees, government contractors, lobbyists, attorneys, and consultants earn well above the national median—and many of them invest in real estate across DC, Northern Virginia, and Maryland. The median home price in the District itself sits around $650,000, with row houses in Capitol Hill, Shaw, and Petworth regularly trading between $800K and $1.5M.

What makes the DC market unique for cost segregation is the tri-jurisdictional tax landscape. Depending on where you live and where your property is located, you may be paying DC income tax (up to 10.75%), Virginia income tax (up to 5.75%), or Maryland income tax (up to 5.75% state plus local county surcharges of 2.25-3.20%). The combined federal-plus-local marginal rate for high-earning DC investors can approach 48%.
All three jurisdictions generally conform to federal depreciation rules, including bonus depreciation. A cost segregation study reduces your tax burden across the board.
DC's top income tax rate is 10.75% on income over $1M. Combined with the 37% federal rate, high-earning DC investors face nearly 48% marginal rates—making every dollar of accelerated depreciation worth almost $0.48 in tax savings.
Washington D.C. Real Estate Market Snapshot
$625,000
$550,000
$42,000
0.85%
Up to 10.75%
High
Government and tourism demand, high-income investor base. Top investment areas: Capitol Hill, Georgetown, Dupont Circle, Adams Morgan.
Source: Public assessor data, Zillow, AirDNA estimates. Values are approximate metro-area medians.
A Real Example: Row House in Capitol Hill
The property: A two-unit row house on Capitol Hill (20003), purchased in September 2022 for $1,150,000. Built in 1890, renovated in 2019. Upper unit rented at $3,400/month, lower English basement unit at $2,100/month. The owner is a partner at a government affairs firm with income of $520,000.
Without cost segregation: Depreciable basis (after 20% land for DC) is approximately $920,000. Straight-line: $33,450 per year.
With cost segregation:
| Category | Amount | Year 1 Deduction |
|---|---|---|
| 5-Year Property (2 kitchens, 2 baths, flooring, fixtures, appliances, built-ins) | $184,000 | $184,000 (100% bonus) |
| 15-Year Property (rear patio, iron fencing, front garden, walkways) | $36,800 | $36,800 (100% bonus) |
| 27.5-Year Property (remaining brick row house structure) | $699,200 | $25,425 (straight-line) |
| Total Year 1 Accelerated Deductions | $220,800 |
At a combined 47% rate (37% federal + 10.75% DC), that $220,800 translates to approximately $103,800 in estimated combined tax savings. The 1890 construction date and two full units of renovated interiors generate an exceptionally high reclassification percentage.
DC Metro Neighborhoods and Investment Profiles
Capitol Hill / Eastern Market (20003): Historic row houses, many pre-1900, commanding $900K-$1.6M. High reclassification rates due to age and renovation investment. English basement units add a second kitchen and bathroom set.
Shaw / U Street / Columbia Heights (20001, 20009, 20010): Gentrified neighborhoods with row house investments and condo conversions. Purchase prices: $700K-$1.2M. Strong rental demand from young professionals.
Petworth / Brightwood Park (20011): Still-appreciating neighborhoods with row houses under $800K. Active investor market with value-add renovation opportunities.
Arlington / Alexandria, VA (22201-22209): Condos and townhouses near the Pentagon, Crystal City, and Amazon HQ2. Virginia's top rate of 5.75% is lower than DC's, but the federal benefit remains the same. Strong rental demand from military and government personnel.
Bethesda / Silver Spring / College Park, MD: Maryland's combined state-plus-county rate can reach 8.95% (Montgomery County). Single-family rentals and small multifamily near NIH, Walter Reed, and UMD. Cost segregation reduces federal and Maryland state taxes simultaneously.
The Government Contractor Angle
The DC area is home to thousands of government contractors earning $150K-$400K+. Many own investment properties across the metro area. The combination of high W-2 income and rental property ownership is the exact profile where cost segregation delivers the most value. If you're a contractor in the 37% bracket paying DC or Maryland taxes on top, accelerated depreciation directly reduces your highest-taxed income.
For STR owners who materially participate (100+ hours managing the property), the deductions become non-passive and can offset your contract income. DC has restricted STRs in certain zones, but properties in Virginia and Maryland suburbs remain viable STR markets.
Airbnb cost segregation guide →
100% Bonus Depreciation and Lookback
The OBBBA permanently restored 100% bonus depreciation. For DC-area investors who purchased in 2021-2024, lookback studies via Form 3115 capture all missed accelerated depreciation in one year.
Washington DC Real Estate Market: Why Cost Segregation Makes Sense Here
The DC metro area is one of the highest-income regions in the country, anchored by the federal government, defense contractors, lobbying firms, and a growing tech presence. Median investment property prices sit around $600K in DC proper, with row houses in Capitol Hill, Petworth, and Shaw frequently exceeding $800K. Across the river in Arlington and Alexandria, single-family rentals command $700K-$1M. Maryland suburbs like Bethesda and Silver Spring add another layer of high-value inventory.
The DC metro's tax landscape is uniquely punishing: DC income tax tops out at 10.75%, Virginia at 5.75%, and Maryland at 5.75% plus county surcharges up to 3.2%. Combined with the 37% federal bracket, DC-area investors face effective rates of 45-50%. That makes every dollar of accelerated depreciation worth nearly 50 cents in real tax savings, placing Washington among the highest-ROI markets for cost segregation in the entire country.
Estimated Year 1 Savings for DC-Area Properties
| Property Type | Price | Est. Year 1 Tax Savings |
|---|---|---|
| DC Row House / SFR | $600K | $32K-$44K |
| DC Airbnb/STR | $750K | $50K-$70K |
| Arlington/Alexandria Duplex | $800K | $42K-$59K |
| DC Condo | $475K | $19K-$27K |
Estimates assume 100% bonus depreciation at the 37% federal + DC/VA/MD state bracket. Actual savings depend on property condition, age, jurisdiction, and furnishing level.
Who Orders Cost Segregation in Washington DC?
DC-area cost seg orders are split between government contractors earning $200K-$400K+ who own investment properties across the metro, GS-15 and SES federal employees with rental properties in the suburbs, and attorneys and lobbyists on K Street who use cost segregation to offset partnership income. We also see a growing number of military officers stationed at the Pentagon or Fort Belvoir who own rentals near installations, and out-of-state investors who bought DC row houses as long-term rental plays.
Whether you own a $475K condo in Navy Yard or an $800K duplex in Takoma Park, a cost segregation study pays for itself many times over in Year 1 tax savings.
Also Serving Nearby Markets
We serve investors across the Mid-Atlantic including Raleigh, Charlotte, and state-by-state tax rules →
Related Reading
Getting Started
Provide your property address, purchase price, type, year built, and improvements. We deliver a CPA-ready report. Your CPA applies it to your federal and DC/VA/MD state returns. Whether your property is in the District, across the river in Arlington, or up the Red Line in Bethesda, the cost seg math works the same way—and the high tax rates in this metro make every accelerated dollar count.
How Much Can You Save in Year One?
Enter your email to see your estimate
More from the Blog
NYC Investors: Cost Segregation at a Combined 50%+ Tax Rate
NYC's triple-layer taxation makes cost segregation one of the highest-ROI moves available.

Cost Segregation for Airbnb Properties: A Complete Guide
How Airbnb and STR investors use cost segregation to accelerate $20K-$80K in depreciation.
Frequently Asked Questions
How much does a cost segregation study cost in Washington DC?
Cost Seg Smart studies start at $495 for properties under $300K and $795 for properties up to $1M — the same price nationwide. There are no travel fees or site visit charges because the IRS does not require a physical inspection. Traditional firms in the Washington DC market typically charge $3,000 to $10,000 for the same analysis.
What's the typical accelerated depreciation for a Washington DC rental property?
Washington DC investment properties typically reclassify 20-35% of depreciable basis into 5-year and 15-year MACRS categories through cost segregation. For a $750,000 rental property, that translates to roughly $56,000 in Year 1 tax savings at the 37% bracket. Short-term rentals tend toward the higher end of this range due to furniture, fixtures, and equipment.
Does District of Columbia conform to federal bonus depreciation rules?
District of Columbia has its own depreciation rules that may differ from federal bonus depreciation provisions. Your federal cost segregation deductions still apply, but consult a tax advisor for state-level treatment.
How fast can I get a cost segregation study for my Washington DC property?
Under one hour from order to delivery. Cost Seg Smart reports are generated using the same RSMeans construction cost data and IRS classification methodology as traditional firms — but delivered in minutes instead of weeks. No scheduling, no site visit, no waiting 4-8 weeks. Your CPA-ready report with MACRS depreciation schedules is emailed immediately after ordering.
Next Steps